Welcome to daycarevirginia.com.
If you are looking for a daycare or preschool in Northern Virginia you
came to the right place. Here you will find all information in one
place. Here are some of the topics : Finding child care - listings
by zip code, Guides helping you decide, Regulations, Web sites
posted by individuals and businesses providing care to children, Public
and Private Schools with links to their web sites. |
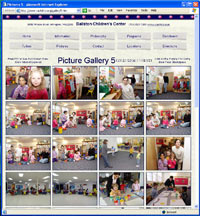 |
Ballston Children's Center
- is open from 7AM to 6PM Monday to Friday. Four meals: breakfast, am snack, lunch, and pm snack.
The Center has educational program. The children learn basic things like letters, numbers, colors, shapes, cut with scissors, paint, write, sing songs. Educational activities prepare the children for elementary school and serve as a first introduction into the learning process. The program also includes extracurricular activities like: ballet-music awareness-movement classes, soccer and other activities.
Click here to get to BCC Web Site
|
| Daycare in Arlington County
Daycare in Fairfax County Virginia |
If you are interested in adding your web site to this directory please add the link and text below to the home page of your website. After you add this text please send us
email. You will be added in 24 hours for free.
Northern Virginia Child Care Information - Directory of public and private schools with links to their web sites. Information about child care, day care, and schools.
Fairfax County Daycare Arlington County Day Care Alexandria City
Childcare Vienna Tyson's
Corner Child Care Daycare in Northern Virginia |